The purpose of this blog is the creation of an open, international, independent and free forum, where every UFO-researcher can publish the results of his/her research. The languagues, used for this blog, are Dutch, English and French.You can find the articles of a collegue by selecting his category. Each author stays resposable for the continue of his articles. As blogmaster I have the right to refuse an addition or an article, when it attacks other collegues or UFO-groupes.
Druk op onderstaande knop om te reageren in mijn forum
Zoeken in blog
Deze blog is opgedragen aan mijn overleden echtgenote Lucienne.
In 2012 verloor ze haar moedige strijd tegen kanker!
In 2011 startte ik deze blog, omdat ik niet mocht stoppen met mijn UFO-onderzoek.
BEDANKT!!!
Een interessant adres?
UFO'S of UAP'S, ASTRONOMIE, RUIMTEVAART, ARCHEOLOGIE, OUDHEIDKUNDE, SF-SNUFJES EN ANDERE ESOTERISCHE WETENSCHAPPEN - DE ALLERLAATSTE NIEUWTJES
UFO's of UAP'S in België en de rest van de wereld Ontdek de Fascinerende Wereld van UFO's en UAP's: Jouw Bron voor Onthullende Informatie!
Ben jij ook gefascineerd door het onbekende? Wil je meer weten over UFO's en UAP's, niet alleen in België, maar over de hele wereld? Dan ben je op de juiste plek!
België: Het Kloppend Hart van UFO-onderzoek
In België is BUFON (Belgisch UFO-Netwerk) dé autoriteit op het gebied van UFO-onderzoek. Voor betrouwbare en objectieve informatie over deze intrigerende fenomenen, bezoek je zeker onze Facebook-pagina en deze blog. Maar dat is nog niet alles! Ontdek ook het Belgisch UFO-meldpunt en Caelestia, twee organisaties die diepgaand onderzoek verrichten, al zijn ze soms kritisch of sceptisch.
Nederland: Een Schat aan Informatie
Voor onze Nederlandse buren is er de schitterende website www.ufowijzer.nl, beheerd door Paul Harmans. Deze site biedt een schat aan informatie en artikelen die je niet wilt missen!
Internationaal: MUFON - De Wereldwijde Autoriteit
Neem ook een kijkje bij MUFON (Mutual UFO Network Inc.), een gerenommeerde Amerikaanse UFO-vereniging met afdelingen in de VS en wereldwijd. MUFON is toegewijd aan de wetenschappelijke en analytische studie van het UFO-fenomeen, en hun maandelijkse tijdschrift, The MUFON UFO-Journal, is een must-read voor elke UFO-enthousiasteling. Bezoek hun website op www.mufon.com voor meer informatie.
Samenwerking en Toekomstvisie
Sinds 1 februari 2020 is Pieter niet alleen ex-president van BUFON, maar ook de voormalige nationale directeur van MUFON in Vlaanderen en Nederland. Dit creëert een sterke samenwerking met de Franse MUFON Reseau MUFON/EUROP, wat ons in staat stelt om nog meer waardevolle inzichten te delen.
Let op: Nepprofielen en Nieuwe Groeperingen
Pas op voor een nieuwe groepering die zich ook BUFON noemt, maar geen enkele connectie heeft met onze gevestigde organisatie. Hoewel zij de naam geregistreerd hebben, kunnen ze het rijke verleden en de expertise van onze groep niet evenaren. We wensen hen veel succes, maar we blijven de autoriteit in UFO-onderzoek!
Blijf Op De Hoogte!
Wil jij de laatste nieuwtjes over UFO's, ruimtevaart, archeologie, en meer? Volg ons dan en duik samen met ons in de fascinerende wereld van het onbekende! Sluit je aan bij de gemeenschap van nieuwsgierige geesten die net als jij verlangen naar antwoorden en avonturen in de sterren!
Heb je vragen of wil je meer weten? Aarzel dan niet om contact met ons op te nemen! Samen ontrafelen we het mysterie van de lucht en daarbuiten.
27-12-2024
Donut-shaped spheres disrupt NASA's Stereo Lasco C3 satellite near the sun
Donut-shaped spheres disrupt NASA's Stereo Lasco C3 satellite near the sun
On December 25, 2024, NASA's Stereo Lasco C3 satellite captured an extraordinary phenomenon near the sun. In a split second, the satellite's imaging was disrupted by what appeared to be a swarm of spherical objects hurtling through space at incredible speeds.
Speculation surrounds the event, with some suggesting it could be a meteor debris field. However, the unusual appearance of the objects has raised questions. Could debris naturally form into such perfectly round shapes, each featuring a dark center that resembles donut-shaped UFOs?
This event might be a natural occurrence, however, with all the recent strange sightings of unknown drones, UFOs, and orbs combined with predictions from several specialists that something significant might happen soon in the realm of the UFO phenomena, one might wonder if these mysterious spheres are connected to something larger on the horizon?
UFOs on official NASA LASCO C2 & LASCO C3 satellite images in the solar space - December 18, 2018
For decades cosmologists have wondered if the large-scale structure of the universe is a fractal: if it looks the same no matter the scale. And the answer is: no, not really. But in some ways, yes. Look, it’s complicated.
Our universe is unimaginably vast and contains somewhere around two trillion galaxies. These galaxies aren’t scattered around randomly, but are assembled into a series of ever-larger structures. There are the groups, containing at most a dozen galaxies are so. Then there are the clusters, which are home to a thousand galaxies and more. Above them are the superclusters, which twist and wind for millions of light-years.
Is this the end of the story?
In the mid 20th century Benoit Mandelbrot brought the concept of fractals into the mainstream. Mandelbrot didn’t invent the concept of fractals – mathematicians had been studying self-similar patterns for ages – but he did coin the word and usher in our modern study of the concept. The basic idea of a fractal is that you can use a single mathematical formula to define a structure at all scales. In other words, you can zoom in and out of a fractal and it still maintains the same shape.
Fractals appear everywhere in nature, from the branches of a tree to the edges of a snowflake. And Mandelbrot himself wondered if the universe is a fractal. If as we zoom out we will see the same kinds of structures appearing again and again.
And in a way, that’s what we see: a hierarchy of structures at ever-larger scales in the universe. But that hierarchy does come to an end. At a certain scale, roughly 300 million lightyears across, the cosmos becomes homogenous, meaning that there are no larger structures and the universe is (at that scale) roughly the same from place to place.
The universe is definitely not a fractal, but parts of the cosmic web still have interesting fractal-like properties. For example, clumps of dark matter called “halos”, which host galaxies and their clusters, form nested structures and sub-structures, with halos holding sub-haloes, and sub-sub-halos inside those.
Conversely, the voids of our universe aren’t entirely empty. They do contain a few, faint dwarf galaxies…and those few galaxies are arranged in a subtle, faint version of the cosmic web. In computer simulations, the sub-voids within that structure contain their own effervescent cosmic webs too.
So while the universe as a whole isn’t a fractal, and Mandelbrot’s idea didn’t hold up, we can still find fractals almost everywhere we look.
VIDEOS
Fractal Universe Theory Unveiled | Investigating The Universe
Is the Universe a Fractal? - Ask a Spaceman!
Fractal Universe Theory Unveiled | Investigating The Universe
A Mission to Dive Titan’s Lakes – and Soar Between Them
Titan is one of the solar system’s most fascinating worlds for several reasons. It has something akin to a hydrological cycle, though powered by methane. It is the solar system’s second-largest moonMooner our own. It is the only other body with liquid lakes on its surface. That’s part of the reason it has attracted so much attention, including an upcoming mission known as Dragonfly that hopes to use its thick atmosphere to power a small helicopter. But some of the most interesting features on Titan are its lakes, and Dragonfly, given its means of locomotion, can’t do much with those other than look at them from afar. So another mission, initially conceived by James McKevitt, then an undergraduate at Loughborough University but now a PhD student at University College London would take a look at both their surface and underneath.
The mission, which has undergone several iterations, was initially designed to mimic the hunting motion of a gannet. This seabird famously dives under the water to search for fish and then floats back up to the top before setting off again. In the original paper describing the mission concept, Mr. McKevitt focused on the hydrodynamics of how such a mission would be possible on Titan, including the physics of diving into a lake of liquid methane without breaking the probe.
Luckily, the most fascinating lakes on Titan are all clustered around the north pole, so it would be theoretically possible to hop between one lake and another, given there was enough thrust/power. However, as time went on, the original mission concept seemed less and less feasible – especially given the most required to both take off from a resting position on top of a lake and dive down deeply enough into the next lake to make a meaningful difference in the environment.
Fraser discusses the importance of a mission to Titan.
Of particular concern was the power system – RTGs, the only current system that would feasibly power such a probe on Titan’s fully enveloped surface, would be too heavy for such a mission architecture. So, Mr. McKevitt changed tact and created something entirely different.
During COVID-19, he created an organization known as Conex Research to explore complex missions in a collaborative think-tank format. He then adapted Astraeus, as the mission was known, to a more achievable format, which was then described on Conex’s website. In a press release from August of 2022, the mission had morphed into a four-part system.
First is a “Main Orbital Spacecraft,” which would orbit the Moon Moondeploy two smaller vehicles – Mayfly and Manta. As their names suggest, Mayfly would flit about as an aerial observation platform, while Manta would dive into the lakes that were so intriguing in the original mission architecture. A series of 2U Cubesats, called “Mites,” would also join them and measure different parts of Titan’s atmosphere during a slow descent period after being released from the MOS.
Fraser discusses the Dragonfly mission planned to visit Titan’s surface.
That sounds like a pretty hefty lift, especially for a group of volunteer contributors, even if there are almost 30 of them. Lately, the group hasn’t had much of an update since they presented the mission format at the International Astronautical Conference in 2022. But if they are still making progress on the mission, there is a chance it might one day make it all the way to the bottom of one of Titan’s lakes.
The James Webb Space Telescope was designed and built to study the early universe, and hopefully revolutionary our understanding of cosmology. Two years after its launch, it’s doing just that.
One of the first things that astronomers noticed with the James Webb was galaxies that were brighter and larger than our models of galaxy formation suggested they should be. They were like seeing teenagers in a kindergarten classroom, challenging our assumptions of cosmology. But while there were some breathless claims that the Big Bang was broken, those statements were a little overblown.
But still, big, bright, mature galaxies in the early universe are forcing us to reconsider how galaxy formation is supposed to proceed. Whatever nature is telling us through the James Webb, it seems to be that galaxies form far faster than we thought before.
Related to that, for several years cosmologists have recognized a certain tension in their measurements of the present-day expansion rate of the universe, called the Hubble rate. Appropriately called the Hubble tension, the difference comes when comparing measurements of the distant, early universe with measurements of the later, nearby universe.
There’s definitely something funky going on here, but cosmologists can’t figure out exactly what. It might have something to do with our measurements of the deep universe, or it might be because of our lack of understanding of dark matter and dark energy. Either way, the James Webb didn’t help anything by confirming that the tension is very, very real.
No matter what comes out of the Hubble tension problem, the James Webb is delivering spectacular results in other areas. One of its primary missions was to find evidence for Population III stars, the first generation of stars to appear in the universe. There are no such stars left in the modern-day cosmos, as they all apparently died off billions of years ago. So our only hope to detect them is to use super-telescopes like the James Webb.
This year a team reported the first tentative detections of a galaxy in the young universe that just might contain Population III stars. The detection is not confirmed, but hopefully upcoming observation campaigns will tell us if we’re on the right track.
No matter what, we know we have a lot left to learn about the universe, and that the James Webb will continue delivering results – and hopefully a few surprises – for years to come.
VIDEOS
Everything Nasa Discovered From James Webbs First Year In Space
Everything NASA Discovered from James Webb's First Year in Space [4K]
NASA releases astonishing new images from James Webb Space Telescope
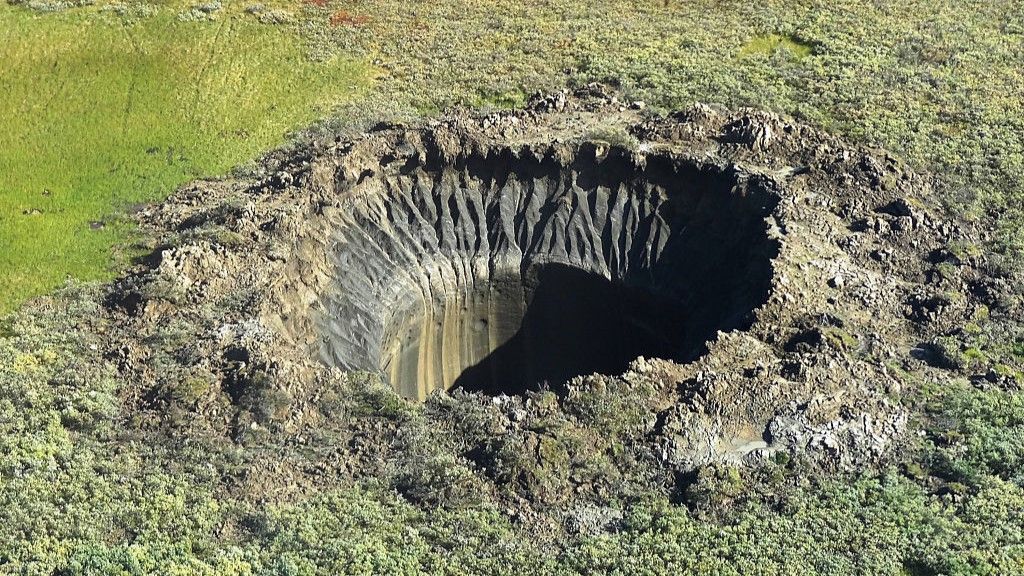
Giant exploding craters only known to exist on Russia's permafrost-covered Yamal and Gydan peninsulas may result from a specific set of conditions not found elsewhere in the Arctic.
This aerial view from a helicopter shows one of the mysterious craters on the Yamal Peninsula.
(Image credit: VASILY BOGOYAVLENSKY/AFP via Getty Images))
Eight giant, 160-foot-deep (50 meters) craters in the Siberian permafrost have baffled scientists since their discovery more than a decade ago — but a new theory may finally explain how they formed.
The Mystery of Siberia's Exploding Craters, Explained
The craters are unique to Russia's northern Yamal and Gydan peninsulas and are not known to exist elsewhere in the Arctic, suggesting the key to this puzzle lies in the landscape, according to a preprint paper published Jan. 12 to the EarthArXiv database.
Researchers have proposed several explanations for the gaping holes over the years, ranging from meteor impacts to natural-gas explosions. One theory suggests the craters formed in the place of historic lakes that once bubbled with natural gas rising from the permafrost below. These lakes may have dried up, exposing the ground beneath to freezing temperatures that sealed the vents through which gas escaped. The resulting buildup of gas in the permafrost may eventually have been released through explosions that created the giant craters.
But the historic-lake model fails to account for the fact that these "giant escape craters" (GECs) are found in a variety of geological settings across the peninsulas, not all of which were once covered by lakes, according to the new preprint, which has not been peer reviewed.
Previousstudies have also linked the craters to accumulations of natural gas within the permafrost, but these can't explain why the holes are only found in northern Russia. "Thus, the formation of GECs points to conditions specific for the Yamal and Gydan peninsulas," researchers wrote in the preprint.
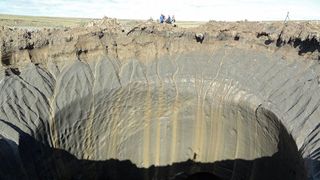
Image taken in 2014 showing one of the craters on Russia's Yamal peninsula.
(Image credit: VASILY BOGOYAVLENSKY/AFP via Getty Images)
Permafrost on the Yamal and Gydan peninsulas varies widely in its thickness, ranging from a few hundred feet to 1,600 feet (500 m). The soil likely froze solid more than 40,000 years ago, imprisoning ancient marine sediments rich in methane that gradually transformed into vast natural gas reserves. These reserves produce heat that melts the permafrost from below, leaving pockets of gas at its base.
Permafrost in Russia and elsewhere is also thawing at the surface due to climate change. In places where it is already thin on the Yamal and Gydan peninsulas, melting from both ends and the pressure from the gas may eventually cause the remaining permafrost to collapse, triggering an explosion.
This "champagne effect" would explain the presence of smaller craters around the eight giant craters, as huge chunks of ice propelled out by the explosions may have severely dented the ground, according to the preprint.
There may also be more of these craters than we realize, the researchers added, as water and sediment likely filled some of the holes over time.
The release of natural gas and methane during these explosions could activate a climate feedback loop if global temperatures continue to creep up and accelerate permafrost melting.
"The formation of GECs has been connected to global climate change, with increasing summer and fall temperatures resulting in permafrost warming and degradation," the researchers wrote.
An estimated 1,900 billion tons (1,700 billion metric tons) of greenhouse gas, including carbon dioxide and methane, are stored in the Arctic permafrost, according to the preprint. Growing emissions from thawing permafrost "are of great concern," the authors added.
VIDEOS
Giant Craters, Some as Deep as 30 Meters, Are Mysteriously Appearing in Siberia | Mashable
'Fireball' in Siberian skies as asteroid hits Earth #noaming #nasa
Watch dramatic moment giant 3,500mph METEOR explodes in sky over Siberia turning night into day
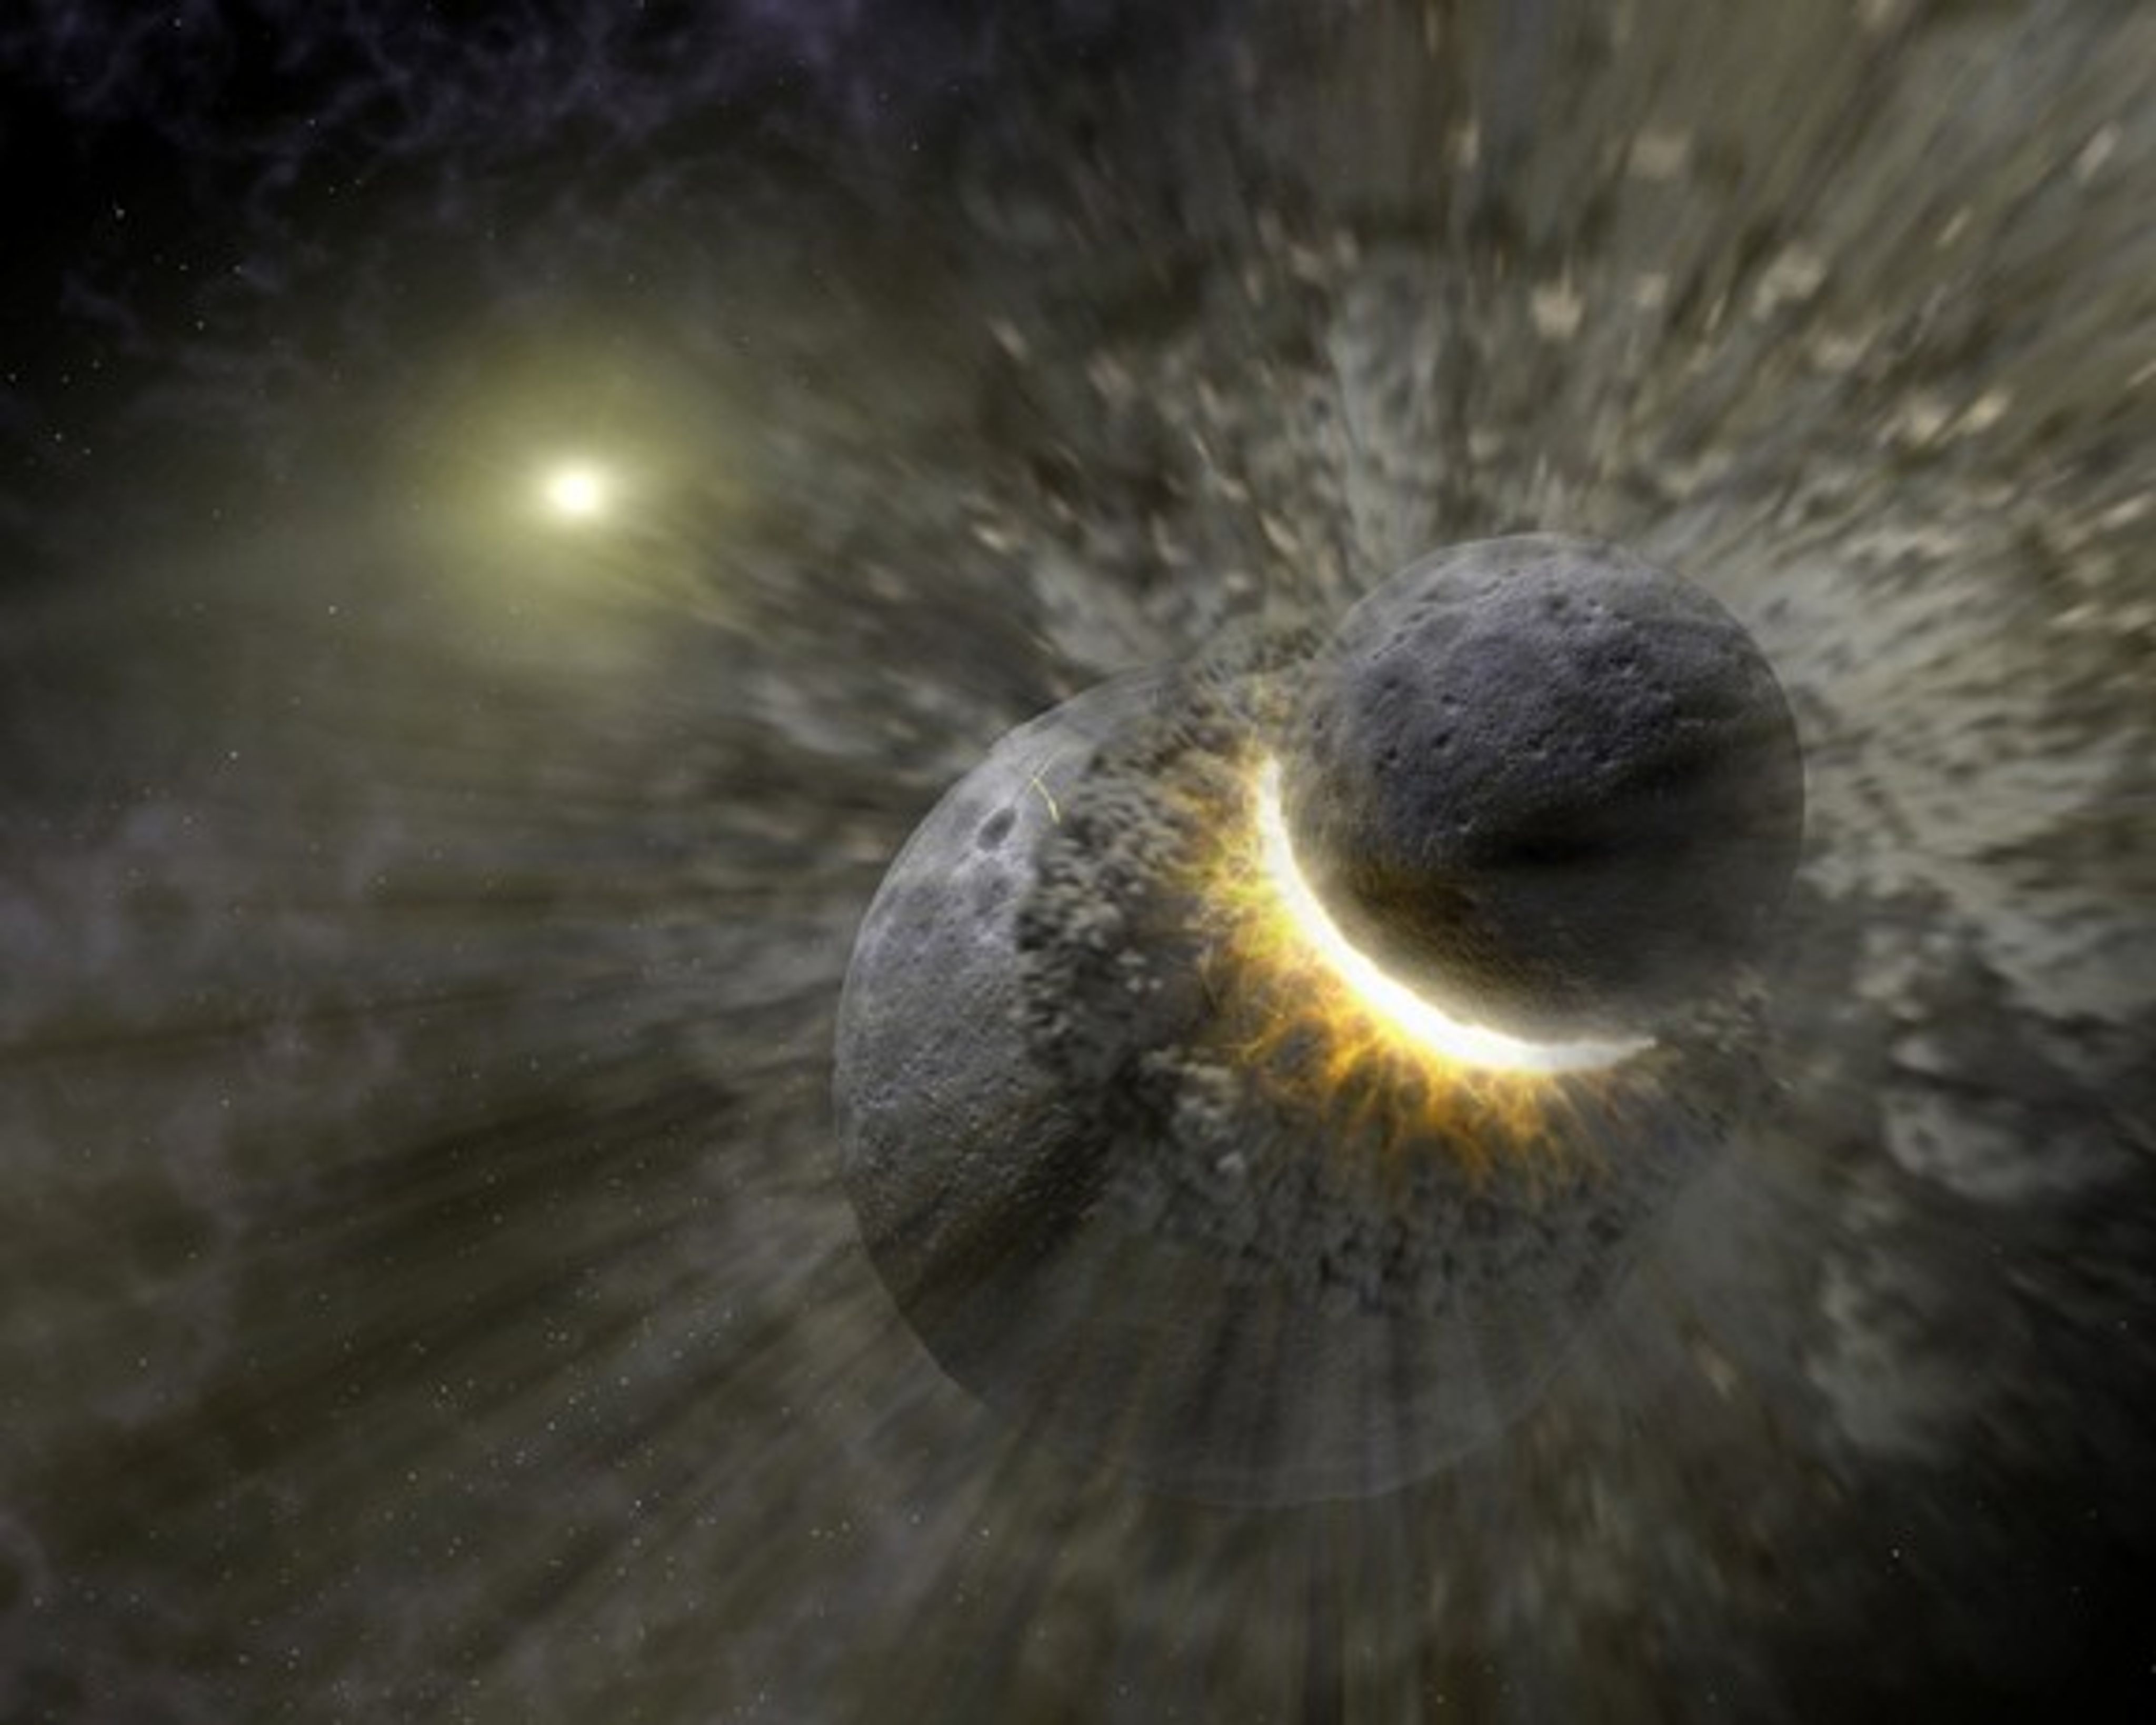
Several theories about our Moon’s formation vie for dominance, but almost all share that point in common: near the time of the solar system’s formation, about 4.5 billion years ago, something ― perhaps a single object the size of Mars, perhaps a series of objects ― crashed into the young Earth and flung enough molten and vaporized debris into space to create the Moon.
Earth’s Moon is thought to have formed in a tremendous collision. A massive object ― named Theia after the mythological Greek Titan who was the mother of Selene, goddess of the Moon ― smashed into Earth, flinging material into space that became the Moon.
NASA
The early solar system would have been a chaotic, terrifying place. Debris left over from the formation of the Sun coalesced into a disk around the star, creating clumps that ranged in size from dust flecks to minor planets. Gravity drew these objects together, causing them to crash into each other ― violent smashups that could end in obliteration or new, larger objects. Those mashed-together objects make up the planets, moons, asteroids and other solar system objects we know today.
A Unique Beginning | How the Universe Works
Written in Stone
Visiting the Moon with the Apollo missions in the late 1960s and early 1970s revolutionized our understanding of the Moon’s origins. Previous concepts ― that the Moon was an object captured by Earth’s gravity as it sailed by, or that the Moon formed alongside Earth from the same debris ― fell out of favor after the Apollo missions brought back data and 842 pounds (382 kilograms) of lunar samples to Earth in the late 1960s and early 1970s. The Apollo evidence all pointed to the Moon forming from a large impact. The age of the rock samples indicated that the Moon formed around 60 million years after the solar system began to form. The type and composition of the samples showed that the Moon had been molten during its formation and was covered with a deep ocean of magma for tens of millions to hundreds of millions of years ― an environment that would occur in the aftermath of an intensely energetic impact. Lunar rocks were found to contain only small amounts of elements that vaporize when heated, further indicating the Moon could have formed in a high-energy impact that let those elements escape.
Five Things We Learned from Apollo Moon Rocks
The chemical composition of Moon and Earth rocks are very similar.
The Moon was once covered in an ocean of magma.
Meteorites have shattered and melted rocks on the Moon’s surface through impacts.
Lava flowed up through cracks in the Moon’s crust and filled its impact basins.
Lunar “soil” is made of pulverized rock created by meteorite impacts.
Scientist and astronaut Harrison H. Schmitt stands next to a huge, split lunar boulder during the Apollo 17 mission at the Taurus-Littrow landing site in this photograph from Dec. 13, 1972. Rock samples collected during the Apollo missions provided evidence that the Moon resulted from an object crashing into Earth in the early history of the solar system.
NASA/Eugene Cernan
Perhaps most importantly, the rock samples indicated that the Moon was once a part of Earth. Basaltic rocks from the Moon’s mantle have striking similarities to basaltic rocks from Earth’s mantle. The oxygen isotopes and other elements sealed into the specimens matched those of Earth rocks too precisely for the similarities to be a coincidence.
Meteorites make up another body of evidence. Samples collected by Apollo astronauts come from just a few sites on the Moon, but lunar meteorites ― rocks sent into space by impacts on the Moon that eventually find their way to Earth ― provide samples from all over the Moon that tell a similar tale of the Moon’s history. Meteorites originating from asteroids have also been used to help confirm the timeline of the Moon’s formation. Some show signs of having been bombarded by debris from the giant, Moon-forming impact.
Finally, more recent studies add the evidence for a high-energy impact that resulted in the creation of a molten Moon. Analysis of light reflecting off the Moon gives details of the mineral makeup of the Moon’s surface, and it shows the widespread presence of anorthosite, an igneous rock that crystallizes out of and floats to the top of magma. The presence of anorthosite across the Moon’s surface reinforces that the Moon must once have been covered by a widespread magma ocean that was quite deep, from hundreds to thousands of kilometers.
This light-colored mineral, Apollo mission lunar sample 60639, is thought to have floated to the top of the magma ocean and formed the Moon's first crust around 4.4 billion years ago.
Lunar Sample Laboratory Facility for Astromaterials 3D Explorer
Lunar “Archaeology”
Though Earth and Moon both came from that ancient collision ― and Earth is certainly within easier reach ― studying the Moon gives us our best chance of understanding what happened all those billions of years ago. Earth’s active geological processes, from plate tectonics to erosion, erase the evidence of formation. Aside from events like impacts, much of the Moon’s surface changes on a vastly slower timescale. Like detectives at a crime scene, scientists use clues preserved on the lunar surface to piece together the Moon’s history. Any improvements to the giant impact theory or a new theory would need to explain what we observe of the Moon today.
One of the oddities is the Moon’s low iron content as compared with Earth’s. Earth’s iron-rich core accounts for around 30 percent of its mass, but the core of the Moon is only about 1.6-1.8 percent of its total mass. One possible explanation is that the energy of the impact with Earth that formed the Moon vaporized lighter materials, casting them into space, and left behind heavier elements ― such as iron, which vaporizes only at extremely high temperatures ― to sink into Earth’s core.
This diagram shows a cross-section of the Moon’s interior during its early history, including the silicate mantle and a small metallic core. The lunar mantle is low in the elements 14 zinc, tin, cadmium, indium, and thulium, possibly because they never recondensed from gas form after the collision that created the Moon.
Illustration courtesy of NASA/JPL-Caltech
Any viable theory of lunar formation also has to explain where the Moon is now in relation to Earth and the speed and inclination of its orbit. Surface reflectors placed on the Moon during Apollo show that the Moon moves away from Earth at the rate of about an inch and a half per year. This indicates that the Moon initially formed much closer to our planet, and, therefore, that the early Earth’s spin rate was much higher than it is today. Computer models created by scientists to test and analyze Moon formation theories must show how a massive collision can produce the existing orbits and rotation of Moon and Earth over billions of years when paired with the typical gravitational interactions between the two bodies. (Even today, the distance between the Earth and Moon, and the length of a day on Earth, continues to grow due to the effects of Earth’s tides.)
Finally, strange discrepancies exist between the Moon’s near and far sides. Differences include: the thickness of the crust ― 43 miles (70 kilometers) on the Moon's near-side versus 93 miles (150 kilometers) on the far side; the contrasting geological makeup, including a concentration of radioactive elements on the near side; and the rich history of volcanism on the near side compared with a relative lack of volcanic activity on the far side. How closely these differences are related to the Moon’s formation ― how it cooled, how its volcanic activity took place, and the manner in which it has been bombarded by objects from space ― is a question scientists continue to wrestle with today.
The Moon's near side and far side.
NASA LRO / Jatan Mehta
Model Behavior
With humanity’s return to the Moon through the Artemis program, scientists expect a flood of new information that will help us hone in on a single formation scenario. In the meantime, scientists continue to study existing samples and other information they have now ― such as information from lunar orbiters and the growing body of knowledge on planetary formation ― to construct computer models that help us understand how the collision might have happened, and how it could have resulted in the Moon and Earth as we see them today. The models account for factors like the strength of the colliding objects, the friction between the components, the density of the components, and how materials behave under different temperatures and pressures. Today’s advanced computer models can provide a number of very specific outcomes based on variables like these.
A NASA and Durham University simulation theorizes that the Moon may have formed in a matter of hours, when material from the Earth and a Mars sized-body were launched directly into orbit after the impact. The simulations used in this research are some of the most detailed of their kind, operating at the highest resolution of any simulation run to study the Moon’s origins or other giant impacts. NASA's Ames Research Center
For instance, when scientists want to figure out why the Moon is low in certain elements that vaporize easily, they use models to see how the Moon’s composition would look if the elements were lost, or depleted, during different periods of the Moon’s formation. Perhaps the environment in which the Moon formed or early eruptions on the Moon’s surface created a temporary atmosphere that led to the elimination of some of those elements, or they may have been released through interactions with the heat of the Sun or a bright and still-molten Earth.
Even these complex models can’t simulate every atom in a massive collision between giant objects that kicks debris into space. But astronomers can represent larger groups of debris by using particles whose properties depend on where they are located during the collision, like hot material situated near the proto-Moon’s core. Astronomers are able to alter the properties in their models to produce different results, showing how even small changes can produce different scenarios. As evidence continues to come in, the eventual goal is a comprehensive model that accounts for everything we know about the Moon.
Searching for the Past in the Future
The final Apollo Moon mission was in 1972. Scientists have had decades to investigate lunar samples and data from the Apollo missions, combine it with information returned by subsequent lunar missions, come to conclusions, and form new questions. They know what to target during the upcoming Artemis missions to help solve some of the outstanding mysteries.
All of the Apollo missions landed near the Moon’s equator, and the samples brought back are mostly from volcanic regions. Lunar scientists are hoping to obtain new samples from different locations, like the far side of the Moon and areas closer to the poles, so they can examine the Moon’s composition in regions that would have evolved in different ways and uncover more evidence of how the Moon formed. They’re hoping to drill down into the lunar surface and acquire core samples that expose additional layers of the Moon’s geologic history, a record written in rock and mostly hidden from us for now.
These new discoveries will help narrow down the many unknown factors in the Moon formation models. If the new evidence shows ― to choose just one example ― that a vast quantity of sulfur was lost during a period of volcanic activity, then that sulfur loss doesn’t need to be accounted for during early stages of Moon formation. Like a game of Clue, deciphering the mysteries of the Moon’s formation will be a process of elimination, ruling out particular events happening during certain time periods and narrowing down the possibilities until few remain.
But scientists are also alert to the possibility of new discoveries, findings that paint a different picture. The greatest clues to the Moon’s past may still be scattered around and beneath the lunar surface, waiting to be unearthed.
Writer: Tracy Vogel
Science Advisors: Prabal Saxena (NASA's Goddard Space Flight Center), Sarah Valencia (NASA's Goddard Space Flight Center) and Bill Bottke (Southwest Research Institute Boulder)
Onze natuurlijke satelliet onderging een ‘vulkanische facelift’, waardoor ze er in feite veel jonger uitziet dan ze in werkelijkheid is.
De maan is nogal geheimzinnig over haar leeftijd. Pogingen om haar leeftijd te ontrafelen hebben schattingen opgeleverd die honderden miljoenen jaren van elkaar verschillen: sommige onderzoekers stellen dat de maan 4,35 miljard jaar geleden ontstond, terwijl anderen haar geboorte op 4,51 miljard jaar geleden plaatsen. Maar wie heeft er nou gelijk? Een nieuwe studie schept gelukkig duidelijkheid.
Twee leeftijden Het is niet verwonderlijk dat onderzoekers van mening verschillen. Analyses van maanmonsters, zoals die verzameld door de Amerikaanse Apollo-missie, suggereren dat onze kosmische metgezel ongeveer 4,35 miljard jaar oud is. Dit zou betekenen dat de maan ongeveer 200 miljoen jaar na de vorming van ons zonnestelsel is ontstaan. Tegelijkertijd zijn er op het oppervlak ook zeldzame kristallen van zirkonium-silicaat, ook wel zirkonen genoemd, gevonden. En die suggereren weer dat de maan 4,51 miljard jaar oud zou kunnen zijn.
200 miljoen jaar Het idee dat de maan 200 miljoen jaar na de vorming van ons zonnestelsel ontstond, zit onderzoekers echter niet lekker. In de vroege dagen van het zonnestelsel kwamen brokstukken en planeetlichamen in botsing en verenigden zich om planeten te vormen. Tegen de tijd dat er 200 miljoen jaar voorbij waren, was het meeste van dit chaotische puin al samengevoegd tot grotere lichamen. Daarom vinden veel wetenschappers die de evolutie van het zonnestelsel simuleren, het idee van een enorme botsing die de maan zo laat vormt, onwaarschijnlijk.
Hoe ontstond de maan? De geschiedenis van de maan begint met een enorme botsing. In de vroege dagen van het zonnestelsel crasht een object ter grootte van Mars tegen de jonge aarde. De impact was zo krachtig dat de rots volledig smolt en een enorme hoeveelheid materiaal de ruimte in werd geslingerd. Langzaam klonterde dit materiaal samen en vormde de maan, die aanvankelijk bedekt was door een oceaan van heet, vloeibaar gesteente. In de miljoenen jaren die volgden, koelde de pas gevormde maan af en bewoog zich steeds verder van de aarde, totdat hij zijn huidige baan bereikte, op ongeveer 384.400 kilometer afstand.
In een nieuwe studie, gepubliceerd in Nature, stellen onderzoekers een mogelijke verklaring voor de discrepantie voor. Ze denken namelijk dat de maan zo’n 4,35 miljard jaar geleden door de getijdenkracht van de aarde opnieuw smolt. Ze beweren dat dit proces de leeftijd van de maanrotsen ‘gereset’ heeft, waardoor de maan er veel jonger uitziet dan ze in werkelijkheid is, bijna alsof de maan een vulkanische facelift had ondergaan.
Earth’s Moon is thought to have formed in a tremendous collision. A massive object ― named Theia after the mythological Greek Titan who was the mother of Selene, goddess of the Moon ― smashed into Earth, flinging material into space that became the Moon.
NASA
Maanbaan Daar gaan we even wat dieper op in. Zoals in het kader te lezen is, stond de maan ooit veel dichterbij de aarde dan nu. “We waren vooral benieuwd naar de periode waarin de afstand tussen de aarde en de maan ongeveer een derde was van wat die nu is”, legt onderzoeksleider Francis Nimmo uit. In deze periode veranderde de positie en vorm van de maanbaan op verschillende manieren. Zo werd de baan meer elliptisch, waardoor de snelheid van de maan en haar afstand tot de aarde merkbaar varieerden tijdens elke omloop. De krachten die hierdoor ontstonden roerden het binnenste van de maan zo sterk door dat het opwarmde. Een soortgelijke situatie zien we vandaag de dag bij Io, de maan van Jupiter, die ook in een licht elliptische baan rond de gasreus draait. De enorme getijdenkrachten van Jupiter maken Io de meest vulkanisch actieve maan in ons zonnestelsel. De vroege maan van de aarde was waarschijnlijk net zo actief als Io.
Geologische klok “Het sterkte vulkanisme heeft waarschijnlijk de geologische klok van de maan gereset”, legt co-auteur Thorsten Kleine uit. “Maanrotsmonsters geven daarom niet hun oorspronkelijke leeftijd prijs, maar alleen wanneer ze voor het laatst hevig verhit werden.” Slechts enkele hittebestendige zirkonen bieden bewijs van een ouder verleden. Op plekken waar lava het oppervlak niet bereikte, bleven de zirkonen koel, waardoor hun interne klok ongemoeid bleef. “De maanrotsmonsters onthullen het volledige, stormachtige verleden van de maan”, vervolgt Kleine. “Ze vertellen ons over haar ontstaan en het heftige vulkanisme dat volgde. Tot nu toe hebben we deze aanwijzingen gewoon niet goed begrepen.”
Werkelijke leeftijd van de maan De onderzoekers komen dan ook met een nieuwe schatting voor de leeftijd van de maan. Zo vermoeden ze dat onze natuurlijke satelliet tussen de 4,43 en 4,53 miljard jaar oud is. Maar haar korst werd, zoals hierboven uitgelegd is, gevormd door hevig vulkanisme, dat ongeveer 4,35 miljard jaar geleden plaatsvond.
Kraters De nieuwe bevindingen lossen ook veel andere tegenstrijdigheden op die wetenschappers eerder in verwarring brachten. Het ontbreken van kraters op de maan werd bijvoorbeeld gezien als een aanwijzing dat ze niet zo oud kon zijn, omdat ze anders veel meer inslagen zou moeten hebben gehad. Vulkanisme biedt nu een verklaring. “Lava uit het binnenste van de maan kan de vroege inslagbekkens hebben opgevuld, waardoor ze bijna onherkenbaar werden”, verklaart onderzoeker Alessandro Morbidelli van het Collège de France.
Het onderzoeksteam hoopt dat nieuwe maanmonsters van toekomstige missies meer licht zullen werpen op de werkelijke leeftijd van de maan. Wetenschappers staan dan ook te popelen om meer te ontdekken over de maanmonsters die onlangs door China’s Chang’e 6-missie zijn teruggebracht. Deze monsters, verzameld van de verre kant van de maan, zijn van onschatbare waarde voor het begrijpen van de processen die haar geschiedenis hebben gevormd. Onderzoekers zijn vooral benieuwd of deze nieuwe monsters het idee van een wereldwijd ‘resettingsproces’ door getijdenverhitting kunnen bevestigen. “Naarmate er meer gegevens beschikbaar komen – vooral van lopende en toekomstige maanmissies – zal ons begrip van de maan blijven groeien”, stelt Nimmo. “We hopen dat onze bevindingen verdere discussies en ontdekkingen zullen stimuleren, wat uiteindelijk leidt tot een helderder beeld van de rol van de maan in de bredere geschiedenis van ons zonnestelsel.”
Afbeelding bovenaan dit artikel: MPS / Alexey Chizhik
This animation shows how material around a young star is shaped into planets over billions of years.
Credit: NASA's Goddard Space Flight Center;
Images courtesy of NASA/JPL-Caltech.
Scientist and astronaut Harrison H. Schmitt stands next to a huge, split lunar boulder during the Apollo 17 mission at the Taurus-Littrow landing site in this photograph from Dec. 13, 1972. Rock samples collected during the Apollo missions provided evidence that the Moon resulted from an object crashing into Earth in the early history of the solar system.
NASA/Eugene Cernan
This light-colored mineral, Apollo mission lunar sample 60639, is thought to have floated to the top of the magma ocean and formed the Moon's first crust around 4.4 billion years ago.
Lunar Sample Laboratory Facility for Astromaterials 3D Explorer
This all-sky photo of the night sky was compiled using images taken by astrophotographer Eckhard Slawik from the best and darkest locations around the globe.
Image credit: NOIRLab / NSF / AURA / E. Slawik / M. Zamani.
“This complete collection of free, high resolution, downloadable images of all 88 western IAU-recognized constellations serves as an educational archive that can be used on the individual and scholastic levels,” NOIRLab astronomers wrote in a statement.
“The project also includes the release of the largest open-source, freely available all-sky photo of the night sky.”
The photographer behind these stunning, high-quality images is the German astrophotographer Eckhard Slawik.
“The images were taken on film and each panel comprises two separate exposures, one with and one without a diffuser filter to allow the stars’ colors to shine through,” the astronomers said.
“All products include a comprehensive description of the constellation and its historic origins, as well as the corresponding standardized stick figure, outline drawing, finder chart and description of the constellation’s most prominent deep-sky objects.”
“Existing astronomical images of such deep-sky objects, captured with various NSF’s NOIRLab telescopes, are also included.”
“Downloadable flash cards and other audiovisual and educational materials make it easy to bring the constellations into the classrooms.”
The NOIRLab astronomers also released the largest open-source, freely available all-sky photo of the night sky.
“With 40,000 pixels, this is arguably one of the best such images ever made,” they wrote.
“The colossal sky-scape was compiled using images taken by Slawik from the best and darkest locations around the globe: in Waldenburg, Germany; Tenerife, La Palma, Spain; Namibia; and Chile.”
“The 88 Constellations images are open for exploration by all ages, and are especially suitable for use in planetariums and museums.”
“Visit the project webpage to become familiar with all 88 constellations and see how many you can spot in your night sky.”
The 88 Magnificent Constellations of the Night Sky
15 Famous Constellations You Can See In The Night Sky | Animation
While NASA is searching for life on Mars, a CIA document claims it was found 40 years ago.
The report, 'Mars Exploration May 22, 1984,' details how the agency used astral projection—the idea that a person's spirit can travel through the astral plane—to transport a 'subject' to Mars approximately one million years BC.
The study was part of Project Stargate, a secret US Army unit established in 1977 that focused on anomalous phenomena, including remote viewing, telepathy, and psychokinesis.
The experiment's 'subject' was transported to the planet during the specified year, reporting an 'oblique view of a pyramid' and a 'very large road' with a monument similar to those known among ancient Egyptians on Earth, the report claims.
The vision then shifted to a population of 'very large people' searching for 'a new place to live because their environment was corrupted.'
Project Stargate was the US government's new weapon against the Soviet Union, aimed at creating mind-reading spies who could infiltrate the minds of its enemies.
The classified project was conducted at Fort Meade in Maryland, recruiting men and women who claimed to have extrasensory perception (ESP) to help uncover military and domestic intelligence secrets.
The experiment's 'subject' was transported to the planet during the specified year, reporting an 'oblique view of a pyramid' and a 'very large road' with a monument similar to those known among ancient Egyptians on Earth
It shut down in 1995, but during its more than 10-year existence, psychics known as 'remote viewers' participated in a wide array of operations, from locating hostages kidnapped by Islamic terrorist groups to tracing the paths of fugitive criminals within the US.
Leading up to its closure was 'Mars Exploration May 22, 1984,' a document declassified in 2017 that has recently resurfaced online.
The document is sparse in details, beginning with: 'Method of site acquisition: Sealed envelope coupled with geographic coordinates.'
The envelope was provided to the subject before the interview but was not opened until afterward.
'In the envelope was a 3x5 card with the following information: The Planet Mars. Time of interest approximately one million BC,' the document reads.
The administrator of the experiment verbally relayed the envelope contents and allowed the subject to provide their observations. The starting time was 10:09 a.m. ET.
The subject was asked to focus their attention on '40.89 degrees north, 9.55 degrees west.'
'It sort of looks... I kind of got an oblique view of a ah... pyramid or pyramid form,' the subject said.
While NASA is searching for life on Mars , a CIA document claims it was found 40 years ago
They continued to describe the structure as okra-colored, a hue ranging from yellow to deep orange and brown.
The subject then observed shadows of 'very tall, thin' people wearing strange clothing.
The administrator prompted the subject to remain in that time period but move to another location in space.
The landscape featured a very long road with what appeared to be the Washington Monument at the end.
'It's like an... obelisk,' the subject said before being asked to move to different locations until they saw people again.
The subject moved to a place where a violent storm was ripping through Mars, and people were using the giant pyramids for shelter.
'Different chambers... but they're almost stripped of any kind of... furnishing or anything. It's like ah... strictly functional, a place for sleeping—or that's not a good word—hibernation, some form,' the subject said.
I can't... I get real raw inputs, storms, savage storms, and sleeping through storms.'
The experiment suggested that a population of people died on Mars after intense storms ripped through the planet
The administrator asked the subject to describe who was sleeping through the storms.
'Very... tall again, very large... people, but they're thin. They look that way because of their height, and they dress like in, oh hell, it's like a real light silk, but it's not flowing type of clothing. It's like cut to fit,' they explained.
The subject told the administrator that these were ancient people who were dying.
'It's past their time or age,' the subject said. 'They're very philosophic about it. They're looking for ah... a way to survive, and they just can't.'
The subject appeared concerned for the ancient people, saying they were looking for a way out or waiting for something to return.
'It's like I'm getting all kinds of overwhelming input of the... corruption of their environment,' the subject said.
'It's failing very rapidly, and this group went somewhere, like a long way, to find another place to live.'
The subject claimed to have spoken with one of these people, who told them that a group had left in what 'looks like the inside of a larger boat.'
The administrator told the subject to go along on the journey and report what they saw.
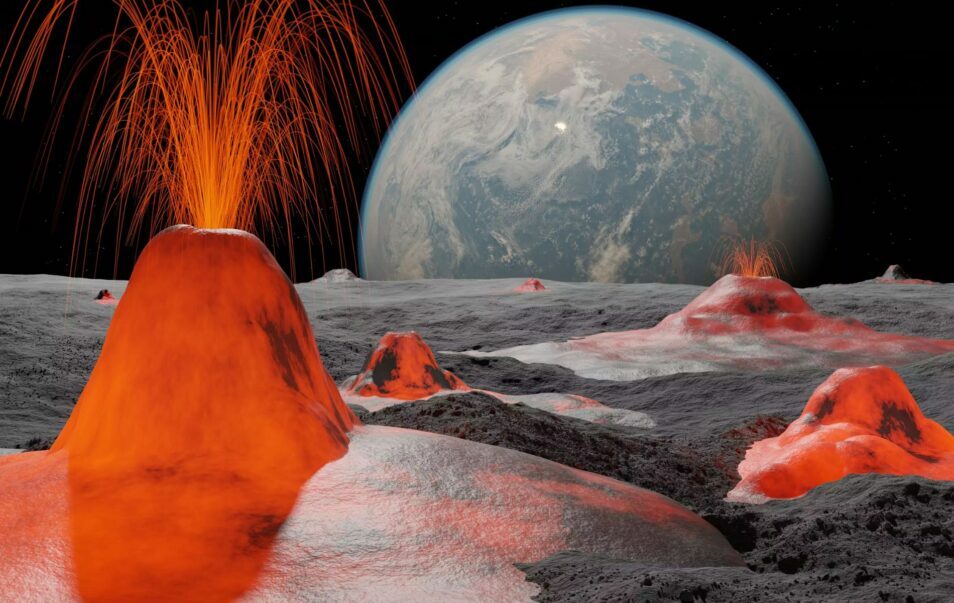
'Impression of a really crazy place with volcanoes and gas pockets and strange plants—a very volatile place. It's very much like going from the frying pan into the fire,' the subject said.
'The difference is there seems to be a lot of vegetation where the other place did not have it. And a different kind of storm.'
The administrator then told the subject it was time to come back.
'Move now back to the room, back to the sound of my voice, back farther now to the sound of my voice on the 22nd of May, 1984,' they told the subject.
Did Life Exist On Mars? | Ancient Mars Was Habitable: Scientists | WION
Has there ever been life on Mars? | The Royal Society
That is more than eight times closer than the distance between our home star and the nearest planet, Mercury.
As it reaches its closest point, the probe will also become the fastest human-made object ever made as it reaches a staggering 430,000 mph (692,000 kph).
In a moment that has been compared to the moon landing of 1969, Parker will 'touch' the sun's surface to gather vital data.
Although the Parker probe will endure temperatures exceeding 1,400 °C (2,550 °F) its near-indestructible heat shield should allow it to survive the extreme conditions.
Nick Pinkine, Parker Solar Probe mission operations manager at the Johns Hopkins Applied Physics Laboratory (APL), says: 'No human-made object has ever passed this close to a star, so Parker will truly be returning data from uncharted territory.'
NASA's Parker Solar Probe (pictured) will make history on Christmas Eve as it becomes the closest human-made object to the sun
Passing at a distance of just 3.8 million miles (6.1 million km), Parker will gather particles from the corona inside a special instrument called the Solar Probe Cup.
The Parker probe will pass within 3.8 million miles (6.1 million km) of the sun's surface, moving at speeds of 30,000 mph (692,000 kph)
At the same time, Parker will surpass its previous speed record of 395,000 mph (635,000 kmph), according to NASA.
At its top speed, the probe will be moving 300 times faster than a Lockheed Martin F-16 fighter jet or 200 times faster than a rifle bullet.
Arik Posner, Parker Solar Probe program scientist for NASA, says: 'This is one example of NASA’s bold missions, doing something that no one else has ever done before to answer longstanding questions about our universe.'
In order to avoid melting during that time, the Parker Solar Probe has been designed to withstand unbelievably high temperatures.
The body of the probe itself is protected by a 2.4-metre (8ft) wide heat shield made of a type of carbon foam.
Although this shield is just 11cm (4.5 inches) thick, its material composition makes it almost indestructible.
Johns Hopkins APL explained in a mission briefing: 'One yard behind that, where the body of the spacecraft resides, it is almost room temperature.
'And all its systems will need to work perfectly for Parker to gather data from this dynamic environment near a star where no spacecraft has dared travel.'
As it passes, the probe will collect particles from the Sun in the 'Solar Probe Cup' (pictured) which is made of Titanium-Zirconium-Molybdenum, a metal alloy with a melting point of 2,349 °C (4,260 °F)
How frequent are superflares?
Earlier estimates had suggested that superflares only occur between once every 1,000 to 10,000 years.
However, due to data limitations, these estimates only used a small set of stars which don't have nearby neighbours.
Across four years of data, a new paper found 2,889 superflares on 2,527 56,450 Earth-like stars.
That would mean a superflare occurs once every century.
Measurements of radioactive elements on Earth point towards a superflare every 1,500 years.
However, the researchers claim that Earth-based studies are not reliable since a superflare might not always leave a radioactive trace.
Meanwhile, the Solar Probe Cup is made of Titanium-Zirconium-Molybdenum, a metal alloy with a melting point of 2,349 °C (4,260 °F).
However, the probe's mission is about more than moving fast and withstanding high temperatures.
The data it brings back could make a huge difference in humanity's defences against devastating solar flares.
Thanks to the intense temperatures and powerful magnetic fields, scientists haven't been able to look inside the sun's corona.
However, this region is the origin of the plasma and magnetic fields which trigger solar flares and coronal mass ejections.
By gathering data from this region, NASA says the Parker Solar Probe will help scientists make better predictions about space weather.
That could buy Earth valuable time to protect our most vulnerable systems in the event of a dangerous solar flare.
This data will help scientists understand what goes on within the sun's super-hot atmosphere. This could help us predict dangerous solar flares which have the potential to cause massive disruption on Earth (stock image)
Mr Posner says: 'We can’t wait to receive that first status update from the spacecraft and start receiving the science data in the coming weeks.'
Parker will transmit a beacon on Friday, December 27 to confirm it has survived the flyby with more data soon to follow.
The probe is then expected to make four more close flybys in 2025, but none so close as tomorrow.
And while the craft will eventually be torn apart by the sun's gravity, the heat shield could continue to orbit for thousands of years to come.
How will the Parker Solar Probe get so close to the sun?
The Parker Solar Probe mission required 55 times more energy than would be needed to reach Mars, according to NASA.
It launched atop a United Launch Alliance Delta IV Heavy, one of the most powerful rockets in the world, with a third stage attached.
But, its trajectory and speed were critical in getting to the correct orbit.
As Earth, and everything on it, are traveling at about 67,000 miles per hour in a direction that’s sideways to the sun, craft was launched backward to cancel out the sideways motion, NASA explains.
The Parker probe passed the sun, so it needed to move about 53,000 miles per hour, according to the space agency.
This required a boost from the powerful Delta IV rocket, and several gravity assists from Venus to slow it down.
The probe will rely on a series of gravity assists from Venus to slow down its sideways motion, allowing it to get just 3.8 million miles away from the sun’s surface.
‘In this case, rather than speeding up the spacecraft, as in a typical gravity assist, Venus slows down its sideways motion so the spacecraft can get close to the sun,’ NASA explains.
‘When it finally does get close, Parker Solar Probe will have lost much of its sideways speed, but gained a great deal of overall speed thanks to the sun’s gravity.
‘Parker Solar Probe will hurtle past the sun at 430,000 miles per hour.’
At its closest approach, it will get just 3.8 million miles from the surface of the sun, making it the only spacecraft to ever venture so close.
FINALLY! NASA's Parker Solar Probe just made history by touching the Sun
Unveiling the Secrets of the Sun: Parker Solar Probe Mission Explained
NASA Science Live: Parker Solar Probe Nears Historic Close Encounter with the Sun
According to NASA's Asteroid Watch dashboard, the space rock 2024 NX1 will reach its closest point to Earth at 02:56 am GMT in the early hours of Christmas Eve.
At an estimated size of 29 to 70 metres (95-230 ft) in diameter, scientists believe 2024 NX1 could hold the destructive potential of 12 million tonnes of TNT.
However, although this will be a 'near miss' by astronomical standards, experts say there is no chance of Christmas being ruined by a collision with this vast space rock.
The space agency estimates that the asteroid should pass by the planet harmlessly at a distance of about 4.48 million miles (7.21 million km).
Jess Lee, astronomer at the Royal Greenwich Observatory, told MailOnline: 'It will be very far away, around 18 times further away from the Earth than the Moon is, and so with this predicted path won’t come close enough to hit the Earth.'
NASA has warned that the huge 'Christmas Eve asteroid' will skim past Earth tonight at 14,743mph
(stock image)
The Christmas Eve asteroid was only spotted on December 12 as NASA and the European Space Agency's (ESA) planetary defence systems noticed its approach.
After calculating its orbit, the agencies listed it as a 'close approach' - meaning that it is expected to pass within 4.65 million miles (7.5 million km) of Earth.
However, based on the size of the asteroid and its distance to Earth, the ESA only rates this as a 'very frequent' approach.
Nor has the ESA included 2024 XN1 on the 'Risk List' of objects with a non-zero probability of colliding with the planet.
This means that, despite passing within touching distance on the solar system scale, there is absolutely no chance of the Christmas Eve asteroid hitting Earth.
And while that is good news for Earth, at this distance the asteroid won't be visible even to an amateur astronomer using their own telescope.
Yet, even for a relatively small asteroid the consequences of a potential impact would be devastating.
NASA's research suggests that an asteroid of 70m in diameter is capable of flattening an area of 700 square miles (2,000 square km) if it collided with the planet.
The asteroid 2024 XN1 (pictured) is as big as a ten-story building and could be up to 70 metres (230 ft) according to the European Space Agency's estimates. The space agencies predict that the asteroid will reach its closest point in at 02:56 am GMT in the early hours of Christmas Eve
The 'Christmas Eve' asteroid
Name: 2024 XN1
Discovery date: December 12, 2024
Estimated diameter:29-70 metres
Date of next approach: December 24, 2024
Closest distance to Earth: 4.48 million miles (7.21 million km)
Risk of collision: Zero
Ms Lee says: 'If you’d like to compare it to a previous asteroid impact, the Tunguska Event in Russia in 1908 involved an asteroid which was a roughly similar size to this one.
'It exploded above the ground and knocked down 80 million trees. The energy comparison estimates have ranged from 3-30 megatons of TNT'
Thankfully, the Tunguska Event occurred over an unihabited region of Siberia but dangerous asteroid impacts have occurred in recent history.
In 2013 a meteor just 20m in diameter exploded 28 miles (45km) above the Russian region of Chelyabinsk.
The resulting blast released the energy equivalent of around 440,000 tonnes of TNT, damaging thousands of buildings and injuring an estimated 1,600 people.
So, although the Christmas Eve asteroid has no risk of colliding with Earth, it is a stark reminder of just how close the planet comes to disaster on a fairly regular basis.
After making its festive appearance next week, 2024 XN1 won't come near Earth again until January 2032.
During this pass the rock will come even closer, reaching a minimum distance of 3.1 million miles (4.7 million km).
At its closest point, the Christmas Eve asteroid will pass within 4.48 million miles (7.21 million km) of Earth. This is a near miss in astronomical terms but there is no risk of a collision
However, the Christmas Eve asteroid will make its closest pass in December of 2106 when it will skim past Earth at a distance of just 2.11 million miles (3.4 million km).
2024 XN1 won't be the only space rock paying Earth a visit over the Christmas period.
Today, a small space rock named 2013 YB actually has a slim chance of slamming into Earth at 12:27 GMT.
However, at less than 3m (10ft) in diameter, this rock is very likely to burn up in the atmosphere, producing nothing more dangerous than a particularly bright fireball.
At this size, NASA estimates that the asteroid would break up in the atmosphere more than 26 miles (43 km) above the ground, making it unlikely that any small fragments will make it to the ground.
Even the odds of that occurring are quite low, as ESA only predicts a one-in-52,356 chance of an impact.
On Christmas Day itself, an even larger asteroid named 2021 BA2 will make a remarkably close pass of Earth.
Based on its brightness, ESA estimates that this space rock could be between 30 to 70 (100-230 ft) metres in diameter - making it a potential 'city killer'.
Earth is constantly being passed by large space rocks, some of which (pictured) have a chance of colliding with the planet. If an asteroid the size of 2024 XN1 hit Earth it would explode with the energy of 12 million tonnes of TNT
At 21:19 pm GMT on Christmas Day, 2021 BA2 will hit its closest point to Earth, passing by at just 1.71 million miles (2.76 million km).
But at more than seven times the distance to the moon, space agencies predict no risk of a collision between the asteroid and the planet.
The next truly large asteroid to pass by Earth won't be until January 5, 2025, when a 400m (1,310 ft) asteroid will make a close pass of the planet.
This Eiffel Tower-sized space rock will blast past Earth at 49,660 miles per hour (79,920 kmph), reaching its closest point just 2.29 million miles (3.68 million km) from Earth.
Currently, NASA would not be able to deflect an asteroid if it were heading for Earth but it could mitigate the impact and take measures that would protect lives and property.
This would include evacuating the impact area and moving key infrastructure.
Finding out about the orbit trajectory, size, shape, mass, composition and rotational dynamics would help experts determine the severity of a potential impact.
However, the key to mitigating damage is to find any potential threat as early as possible.
NASA and the European Space Agency completed a test which slammed a refrigerator-sized spacecraft into the asteroid Dimorphos.
The test is to see whether small satellites are capable of preventing asteroids from colliding with Earth.
The Double Asteroid Redirection Test (DART) used what is known as a kinetic impactor technique—striking the asteroid to shift its orbit.
The impact could change the speed of a threatening asteroid by a small fraction of its total velocity, but by doing so well before the predicted impact, this small nudge will add up over time to a big shift of the asteroid's path away from Earth.
This was the first-ever mission to demonstrate an asteroid deflection technique for planetary defence.
The results of the trial are expected to be confirmed by the Hera mission in December 2026.
VIDEOS
Breaking News: Huge 'Christmas Eve asteroid' the size of a 10-story building will skim past Earth...
The updated version of the World Magnetic Model was released on Dec. 17, with a new prediction of how the magnetic north pole will shift over the next five years. Here's why it was changed.
A planned update to the World Magnetic Model will help ensure that navigational systems keep users on track for years to come.
(Image credit: UniversalImagesGroup via Getty Images)
On Dec. 17, the National Centers for Environmental Information (NCEI) and the British Geological Survey (BGS) released an updated version of the World Magnetic Model, a prediction for how Earth's magnetic field will shift and change over the next five years.
The World Magnetic Model, which predicts the difference between magnetic north and true north at every point on Earth, plays an integral role in satellite and aircraft navigation and helps smartphone users orient themselves using services like Google Maps.
The update has been planned for years, and most users won't notice anything different as a result of the changes. But the changes are necessary to keep navigational systems functioning and to make better future predictions about Earth's magnetic field.
Why does Earth have a magnetic field?
Earth's main magnetic field is generated in the planet's outer core, a layer of molten iron 2,2001,800-3,100 miles (2,890-5,000 kilometers) below the planet's surface. The electrically conductive liquid iron is in constant motion, and when it moves through an existing weak magnetic field, that motion produces an electric current. The electric current in turn generates its own magnetic field, leading to a self-sustaining process known as the geodynamo.
The geodynamo has continually regenerated Earth's magnetic field for billions of years. Without something to sustain the field, Earth would have lost its magnetic field after about 40,000 years, said Bruce Buffett, a geophysicist at the University of California, Berkeley.
"If you had a hot cannonball and you put it on the table, it would gradually cool. [The heat] would diffuse away and essentially go back to ambient," Buffett told Live Science. "The same is true with the magnetic field. If you're not sustaining it by these fluid motions, it will gradually decay away and disappear."
Where is the magnetic north pole?
The magnetic north pole is different from the geographic North Pole, which is always stationary. The geographic North Pole is the point where Earth's axis of rotation meets the planet's surface and where all lines of longitude converge. The magnetic north pole, meanwhile, is the point in the Northern Hemisphere where Earth's magnetic field lines point directly into the planet.
The complex motion of the outer core causes the magnetic north pole to shift tens of miles per year. Because Earth's magnetic field is slightly asymmetrical and more complex than that of a regular bar magnet, the magnetic south pole — the point in the Southern Hemisphere where the magnetic field points straight into the planet — doesn't move in quite the same way. But changes in the strength of the magnetic field near the North Pole have caused it to shift from the Canadian Arctic toward Siberia in recent years.
The Truth About Earth’s Magnetic North Pole Shift
What is the World Magnetic Model?
The World Magnetic Model is a mathematical model of Earth's magnetic field and a prediction for how the field will evolve over the next several years. The model combines data from satellites such as the European Space Agency'sSwarm mission and from high-precision magnetometers at ground-based observatories to predict the magnetic field at each point on Earth.
Navigation apps use the World Magnetic Model along with GPS to orient users. "Your smartphone or GPS system has a magnetometer, effectively a digital compass built into it," said William Brown, a BGS geophysicist who helped create and update the World Magnetic Model. "It measures the direction of the magnetic field where you are, and it enters your position into the World Magnetic Model software to tell it what the magnetic field should look like. And then, by comparing what I measured and what I should have got, you can work out which direction you're facing."
Why is the World Magnetic Model being updated now?
A new version of the World Magnetic Model is released every five years to account for changes in the magnetic field from the motion of the outer core. This latest update is part of that five-year schedule.
"The real challenge is, and the reason why we release a model every five years, it doesn't change in a regular way. It's not completely predictable. It's a really complicated, chaotic system," Brown told Live Science. "Typically, about five years is when the accuracy of the model starts to get to the point where it's not as good as we would like it. So we make a better prediction with five years more information to work from, and just update the prediction going forward."
Small deviations from the predicted field can accumulate over time and occasionally compound to the point where the model must be updated more frequently. For example, the NCEI and BGS released an off-cycle update in 2019 to account for the outer core flowing faster than usual in the Northern Hemisphere — a phenomenon that caused the magnetic north pole to shift much more quickly than usual.
But for most people, the 2025 update won't result in any noticeable changes to navigation, and users won't have to change anything for phone map apps to work properly.
"You should be able to navigate as well as you could yesterday," Brown said. "We keep the updates coming so that it's only a bit of time, small enough that most people don't notice, because for most users, the accuracy is more than they need anyway."
The Magnetic North Pole Has Officially Changed Position
This Is What the Earth Sounds Like From Space! (Creepy) (4K)
Where’s the Most Promising Place to Find Martian Life?
In this April 30, 2021, file Image taken by the Mars Perseverance rover and made available by NASA, the Mars Ingenuity helicopter, right, flies over the surface of the planet. A new study suggests water on Mars may be more widespread and recent than previously thought. Scientists reported the finding from China's Mars rover in Science Advances on Friday, April 28, 2023. Credit: NASA/JPL-Caltech/ASU/MSSS
Where’s the Most Promising Place to Find Martian Life?
New research suggests that our best hopes for finding existing life on Mars isn’t on the surface, but buried deep within the crust.
Several years ago NASA’s Curiosity rover measured traces of methane in the Martian atmosphere at levels several times the background. But a few months later, the methane disappeared, only for it to reappear again later in the year. This discovery opened up the intriguing possibility of life still clinging to existence on Mars, as that could explain the seasonal variability in the presence of methane.
But while Mars was once home to liquid water oceans and an abundant atmosphere, it’s now a desolate wasteland. What kind of life could possibly call the red planet home? Most life on Earth wouldn’t survive long in those conditions, but there is a subgroup of Earthly life that might possibly find Mars a good place to live.
These are the methanogens, a type of single-celled organism that consume hydrogen for energy and excrete methane as a waste product. Methanogens can be found in all sorts of otherwise-inhospitable places on Earth, and something like them might be responsible for the seasonal variations in methane levels on Mars.
In a recent paper submitted for publication in the journal AstroBiology, a team of scientists scoured the Earth for potential analogs to Martian environments, searching for methanogens thriving in conditions similar to what might be found on Mars.
The researchers found three potential Mars-like conditions on Earth where methanogens make a home. The first is deep in the crust, sometimes to a depth of several kilometers, where tiny cracks in rocks allow for liquid water to seep in. The second is lakes buried under the Antarctic polar ice cap, which maintain their liquid state thanks to the immense pressures of the ice above them. And the last is super-saline, oxygen-deprived basins in the deep ocean.
All three of these environments have analogs on Mars. Like the Earth, Mars likely retains some liquid water buried in its crust. And its polar caps might have liquid water lakes buried underneath them. Lastly, there has been tantalizing – and heavily disputed – evidence of briny water appearing on crater walls.
In the new paper, the researchers mapped out the temperature ranges, salinity levels, and pH values across sites scattered around the Earth. They then measured the abundance of molecular hydrogen in those sites, and determined where methanogens were thriving the most.
For the last step, the researchers combed through the available data about Mars itself, finding where conditions best matched the most favorable sites on Earth. They found that the most likely location for possible life was in Acidalia Planitia, a vast plain in the northern hemisphere.
Or rather, underneath it. Several kilometers below the plain, the temperatures are warm enough to support liquid water. That water might have just the right pH and salinity levels, along with enough dissolved molecular hydrogen, to support a population of methanogen-like creatures.
Now we just have to figure out how to get there.
VIDEOS
NASA's Incredible Findings On Martian Life Revealed!
Discovering Mars: Habitable More Recently Than We Imagined?
Could Alien Life Thrive in Mars' Deep Lakes? Unveiling the Secrets
NASA is Developing Solutions for Lunar Housekeeping’s Biggest Problem: Dust!
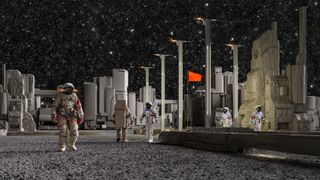
Through the Artemis Program, NASA will send the first astronauts to the Moon since the Apollo Era before 2030. They will be joined by multiple space agencies, like the ESA and China, who plan to send astronauts (and “taikonauts”) there for the first time. Beyond this, all plan to build permanent habitats in the South Pole-Aitken Basin and the necessary infrastructure that will lead to a permanent human presence. This presents many challenges, the most notable being those arising from the nature of the lunar environment.
Aside from the extremes in temperature, a 14-day diurnal cycle, and the airless environment, there’s the issue of lunar regolith (aka moondust). In addition to being coarse and jagged, lunar regolith sticks to everything because it is electrostatically charged. Because of how this dust plays havoc with astronaut health, equipment, and machinery, NASA is developing technologies to mitigate dust buildup. Seven of these experiments will be tested during a flight test using a Blue Origin New Shepard rocket to evaluate their ability to mitigate lunar dust.
Another major problem with lunar regolith is how it gets kicked up and distributed by spacecraft plumes. With essentially no atmosphere and lower gravity (16.5% of Earth’s), this dust can remain aloft for extended periods of time. Its jagged nature, resulting from billions of years of meteor and micrometeoroid impacts and a total lack of weathering, is abrasive to any surface it comes into contact with, ranging from spacesuits and equipment to human skin, eyes, and lungs. It will also build up on solar panels, preventing missions from drawing enough power to survive a lunar night.
In addition, it can also cause equipment to overheat as it coats thermal radiators and accumulates on windows, camera lenses, and visors, making it harder to see, navigate, and acquire accurate images. Kristen John, the Lunar Surface Innovation Initiative technical integration lead at NASA’s Johnson Space Center, said in a NASA press release: “The fine grain nature of dust contains particles that are smaller than the human eye can see, which can make a contaminated surface appear to look clean.”
ClothBot: This compact robot is designed to simulate and measure how dust behaves in a pressurized environment, which astronauts could bring back after conducting Extravehicular Activities (EVAs). The robot relies on pre-programmed motions that simulate astronauts’ movements when removing their spacesuits (aka “doffing”), releasing a small dose of lunar regolith simulant. A laser-illuminated imaging system will then capture the dust flow in real-time while sensors record the size and number of particles.
Electrostatic Dust Lofting (EDL): The EDL will examine how lunar dust is “lofted” (kicked up) when it becomes electrostatically charged to improve models on dust lofting. During the lunar gravity phase of the flight, a dust sample will be released that the EDL will illuminate using a UV light source, causing the particles to become charged. The dust will then pass through a sheet laser as it rises from the surface while the EDL observes and records the results. The EDL’s camera will continue to record the dust until the mission ends, even after the lunar gravity phase ends and the UV light is shut off.
The Lunar Lab and Regolith Testbeds at NASA’s Ames Research Center. Credit: NASA/Uland Wong.
Hermes Lunar-G: The Hermes Lunar-G project, developed by NASA, Texas A&M, and Texas Space Technology Applications and Research (T-STAR), is based on a facility (Hermes) that previously operated on the International Space Station (ISS). Like its predecessor, the Lunar-G project will rely on repurposed Hermes hardware to study lunar regolith simulants. This will be done using four canisters containing compressed lunar dust simulants. When the flight enters its lunar gravity phase, these simulants will decompress and float around in the canisters while high-speed cameras and sensors capture data. The results will be compared to microgravity data from the ISS and similar flight experiments.
Dust Mitigation Strategies
The data obtained by these projects will provide information on regolith generation rates, transport, and mechanics that will help scientists refine computational models. This will allow mission planners and designers to develop better strategies for dust mitigation for future missions to the Moon and Mars. Already, this challenge informs several aspects of NASA’s technological developments, ranging from In-Situ Resource Utilization (ISRU) and construction to transportation and surface power. Said John:
“Learning some of the fundamental properties of how lunar dust behaves and how lunar dust impacts systems has implications far beyond dust mitigation and environments. Advancing our understanding of the behavior of lunar dust and advancing our dust mitigation technologies benefits most capabilities planned for use on the lunar surface.”
The test flight and vehicle enhancements that will enable the simulation of lunar gravity are being funded through NASA’s Flight Opportunities program.
Carbon Dioxide Ice Turns Martian Polar Region White
Carbon Dioxide Ice Turns Martian Polar Region White
Planetary scientists using the High Resolution Stereo Camera on ESA’s Mars Express spacecraft have captured stunning images of an enigmatic landscape in the Australe Scopuli region of the Red Planet’s southern hemisphere.
Frosty scene in the Australe Scopuli region at the south pole of Mars.
Image credit: ESA / DLR / FU Berlin.
“Here, swirls of carbon dioxide ice and dust layers wrap around the scene, turning the Red Planet white,” the ESA researchers said in a statement.
“The contrasting light and dark layers are particularly striking in the exposed faces of hills and valleys.”
An artist's interpretation of an ice-covered river sourced from meltwater beneath Mars’ south polar cap.
Credit: Peter Buhler/PSI
“They trace out the distinctive seasonal polar layered deposits characteristic of this region, formed as layers of ice freeze with varying amounts of dust trapped within.”
“Perhaps you’d prefer a sleigh ride, but either way dress warm, because it’s cold outside: minus 125 degrees Celsius (minus 193 degrees Fahrenheit),” they added.
“Any Martian skier or sleigh rider would also need to slalom around hundreds of potential dust jets.”
“That’s because ski season is almost over and it’s beginning to look a lot like spring — or even summer, for this image was taken on June 16, 2022, close to summer solstice at the south pole.”
Zooming into the image above reveals numerous dark patches where the ice has already sublimated away, a sure sign that the Sun’s warming rays have been falling on this region for some time.
“When sunlight shines through the translucent top layers of the carbon dioxide ice it warms up the underlying surface,” the scientists explained.
“The ice at the bottom of the layer begins to sublimate, creating pockets of trapped gas.”
“The pressure builds up until the overlying ice suddenly cracks, resulting in a burst of gas jetting through the surface.”
“These gas fountains carry dark dust from below, which falls back to the surface in a fan-shaped pattern moulded by the direction of the prevailing wind.”
“The fans can range in length from tens to hundreds of meters.”
“An even closer look shows that the fans often appear to follow the boundaries between the polar layered deposits.”
“Presumably these boundaries represent zones of weakness, where the escaping dust-laden jets can break through the ice layers more easily.”
“We may well have missed our chance to make ‘Frosty the Snowman’, but it’s still a wonderful time of year on Mars.”
The Earth's magnetic North Pole is currently moving toward Russia in a way that British scientists have not seen before.
Scientists have been tracking the magnetic North Pole for centuries, telling the British newspaper The Times that it had moved closer to the northern coast of Canada. In the 1990s, it drifted into the Atlantic before moving in a faster manner toward Siberia in Russia.
Compass needles in the Northern Hemisphere point toward the magnetic North Pole, although the exact location of it changes from time to time as the contours of Earth’s magnetic field also change. The magnetic North Pole is sometimes confused with the geographic North Pole, but this spot stays at the same place as it is where all lines of longitude converge.
In the 300 years between 1600 and 1900, scientists estimate that the magnetic North Pole moved about six miles per year. At the beginning of this century, it picked up to about 34 miles per year, before slowing in the last five years to about 22 miles per year.
Magnetic north has shifted a lot over the centuries.
(BGS)
Why does the North Pole's movement matter?
The moves are tracked as the data allows the compasses in our smartphones and other navigation devices to navigate.
Scientists told The Times these movements are tracked by the British Geological Survey and the U.S. National Oceanic and Atmospheric Administration. In conjunction, they make the World Magnetic Model, that predicts where the pole should be at any time.
The model plays a role in the GPS systems we use on a day-to-day basis.
“Planes, boats, submarines, you name it, it’s in there,” William Brown, the global geomagnetic field modeler at the British Geological Survey, said in an interview with The Times.
It's time to recalibrate the navigation systems on ships, airplanes, and (given the time of year) Santa's sleigh: the position of the magnetic North Pole is officially being changed, continuing its shift away from Canada and towards Siberia.
Experts from the US National Oceanic and Atmospheric Administration (NOAA) and the British Geological Survey (BGS) have joined forces – as they do every five years – to produce a new, more accurate World Magnetic Model (WMM).
While the geographical North Pole stays fixed in place (at the very summit of the Earth's rotational axis), the WMM pinpoints the magnetic North Pole – where Earth's magnetic field points straight down, a perfectly vertical magnetic field.
And as the iron and nickel inside our planet shift, so does Earth's magnetic field, meaning the North (and South) Poles are also constantly on the move. If you're using a compass or a GPS system, knowing exactly where these points are is crucial.
"The current behaviour of magnetic north is something that we have never observed before," says global geomagnetic field modeller William Brown, from BGS.
"Magnetic north has been moving slowly around Canada since the 1500s but, in the past 20 years, it accelerated towards Siberia, increasing in speed every year until about five years ago, when it suddenly decelerated from 50 to 35 kilometers [31 to 22 miles] per year, which is the biggest deceleration in speed we've ever seen."
Research suggests that two giant magnetic lobes – one under Canada and one under Siberia – are what's driving the shifting of magnetic north. Sometimes the shifts are dramatic enough that an emergency update is required, outside of the usual 5-year cycle.
Now we have a more accurate map of magnetic north, one that should be good for another half a decade. For the first time, a higher resolution map is also available, which offers more than 10 times more detail: it has a spatial resolution of about 300 km at the equator compared to the standard 3,300 km.
The 2025 World Magnetic Model. (NOAA/NCEI)
What causes the movements?
Earth’s outer core is made up of mostly molten iron, a liquid metal. Unpredictable changes in the way it flows cause the magnetic field around the Earth to shift, which then causes the magnetic core to also move.
“It’s like a giant cup of tea,” Brown said to The Times. “It’s a hot liquid with the viscosity of water.”
Fernando Cervantes Jr. is a trending news reporter for USA TODAY. Reach him at fernando.cervantes@gannett.com and follow him on X @fern_cerv_.
According to the BGS team, traveling 8,500 km (5,282 miles) from South Africa to the UK in a straight line would leave you 150 km (93 miles) off course by the end, if you used the old WMM compared to the new WMM for your navigation.
That's how much difference it can make, and mapping and logistics companies, together with governments and official agencies, will now be making updates.
However, we won't have to apply any updates to our own phones or sat navs – it'll all happen automatically.
The magnetic North Pole was first discovered by Sir James Clark Ross in northern Canada back in 1831.
Since then, researchers have gradually been able to track it with more precision, using ground measurements taken all across the globe as well as readings from satellites in space.
The Magnetic North Pole Has Officially Changed Position
This Christmas Eve, children around the world may be hoping to catch a glimpse of Santa's sleigh flying through the skies.
But NASA has warned that jolly Old Saint Nick won't be the only thing whizzing over our heads this December 24.
A massive 'Christmas Eve asteroid' the size of a 10-story building will skim past Earth at 14,743mph.
According to NASA's Asteroid Watch dashboard, asteroid 2024 XN1 should pass by harmlessly at a distance of 4.48 million miles (7.21 million km) from Earth.#
Although this will be a near miss by astronomical standards, experts say there is no chance of Christmas being ruined by a collision with this vast space rock.
Jess Lee, astronomer at the Royal Greenwich Observatory, told MailOnline: 'It will be very far away, around 18 times further away from the Earth than the Moon is, and so with this predicted path won’t come close enough to hit the Earth.'
But at an estimated size of 29 to 70 metres (95-230 ft) in diameter, this is a stark reminder of just how close Earth can get to a deadly encounter.
If 2024 XN1 were to hit the planet, scientists estimate that it would impact with a force equivalent to 12 million tonnes of TNT and flatten an area of 700 square miles (2,000 square km).
NASA has warned that the huge 'Christmas Eve asteroid' will skim past Earth on December 24 at 14,743mph
(stock image)
The Christmas Eve asteroid was only spotted on December 12 as NASA and the European Space Agency's (ESA) planetary defence systems noticed its approach.
After calculating its orbit, the agencies listed it as a 'close approach' - meaning that it is expected to pass within 4.65 million miles (7.5 million km) of Earth.
2024 XN1 will reach its closest point to Earth at 02:56 am GMT on the morning of Christmas Eve.
However, based on the size of the asteroid and its distance to Earth, the ESA only rates this as a 'very frequent' approach.
Nor has the ESA included 2024 XN1 on the 'Risk List' of objects with a non-zero probability of colliding with the planet.
This means that, despite passing within touching distance on the solar system scale, there is absolutely no chance of the Christmas Eve asteroid hitting Earth.
And while that is good news for Earth, at this distance the asteroid won't be visible even to an amateur astronomer using their own telescope.
Yet, even for a relatively small asteroid the consequences of a potential impact would be devastating.
The asteroid 2024 XN1 (pictured) is as big as a ten-story building and could be up to 70 metres (230 ft) according to the European Space Agency's estimates
At its closest point, the Christmas Eve asteroid will pass within 4.48 million miles (7.21 million km) of Earth. This is a near miss in astronomical terms but there is no risk of a collision
The 'Christmas Eve' asteroid
Name: 2024 XN1
Discovery date: December 12, 2024
Estimated diameter: 29-70 metres
Date of next approach: December 24, 2024
Closest distance to Earth: 4.48 million miles (7.21 million km)
Risk of collision: Zero
“Christmas Eve Asteroid Warning!”
Ms Lee says: 'If you’d like to compare it to a previous asteroid impact, the Tunguska Event in Russia in 1908 involved an asteroid which was a roughly similar size to this one.
'It exploded above the ground and knocked down 80 million trees. The energy comparison estimates have ranged from 3-30 megatons of TNT'
After making its festive appearance next week, 2024 XN1 won't come near Earth again until January 2032.
During this pass the rock will come even closer, reaching a minimum distance of 3.1 million miles (4.7 million km).
However, the Christmas Eve asteroid will make its closest pass in December of 2106 when it will skim past Earth at a distance of just 2.11 million miles (3.4 million km).
2024 XN1 won't be the only space rock paying Earth a visit over the Christmas period.
On December 23, a small space rock named 2013 YB actually has a slim chance of slamming into Earth.
However, at less than 3m (10ft) in diameter, this rock is very likely to burn up in the atmosphere, producing nothing more dangerous than a particularly bright fireball.
Earth is constantly being passed by large space rocks, some of which (pictured) have a chance of colliding with the planet. If an asteroid the size of 2024 XN1 hit Earth it would explode with the energy of 12 million tonnes of TNT
Even the odds of that occurring are quite low as ESA only predicts a one in 52,356 chance of an impact.
On Christmas Day itself, an even larger asteroid named 2021 BA2 will make a remarkably close pass of Earth.
Based on its brightness, ESA estimates that this space rock could be between 30 to 70 (100-230 ft) metres in diameter - making it a potential 'city killer'.
At 21:19 pm GMT on Christmas Day, 2021 BA2 will hit its closest point to Earth, passing by at just 1.71 million miles (2.76 million km).
But at more than seven times the distance to the moon, space agencies predict no risk of a collision between the asteroid and the planet.
The next truly large asteroid to pass by Earth won't be until January 5, 2025, when a 400m (1,310 ft) asteroid will make a close pass of the planet.
This Eiffel Tower-sized space rock will blast past Earth at 49,660 miles per hour (79,920 kmph), reaching its closest point just 2.29 million miles (3.68 million km) from Earth.
Currently, NASA would not be able to deflect an asteroid if it were heading for Earth but it could mitigate the impact and take measures that would protect lives and property.
This would include evacuating the impact area and moving key infrastructure.
Finding out about the orbit trajectory, size, shape, mass, composition and rotational dynamics would help experts determine the severity of a potential impact.
However, the key to mitigating damage is to find any potential threat as early as possible.
NASA and the European Space Agency completed a test which slammed a refrigerator-sized spacecraft into the asteroid Dimorphos.
The test is to see whether small satellites are capable of preventing asteroids from colliding with Earth.
The Double Asteroid Redirection Test (DART) used what is known as a kinetic impactor technique—striking the asteroid to shift its orbit.
The impact could change the speed of a threatening asteroid by a small fraction of its total velocity, but by doing so well before the predicted impact, this small nudge will add up over time to a big shift of the asteroid's path away from Earth.
This was the first-ever mission to demonstrate an asteroid deflection technique for planetary defence.
The results of the trial are expected to be confirmed by the Hera mission in December 2026.
OTHER VIDEOS
NASA On Alert As 120-foot Asteroid Is Set To Approach Earth On Christmas Eve | GRAVITAS | WION
NASA alert! Gigantic 120-foot asteroid to fly past Earth at 7 km per second on Christmas Eve
China is testing a supersonic jet that's even faster than the 'Son of Concorde' - and it could whizz passengers from London to New York in less than 2 hours
In tests, the jet's engine reached Mach 4 or 3,045mph – four times the speed of sound – at altitudes of more than 65,600 feet, reports South China Morning Post.
This is twice as fast as the defunct Concorde's max speeds (Mach 2 or 1,338mph) and three times that of NASA's 'Son of Concorde' (937 miles per hour).
'This engine has significant commercial potential in the field of high-speed flight within near-space environments,' Space Transportation said in a statement.
The successful test flight is a key milestone for developing the Yunxing supersonic civilian jet, which will fly passengers from London to New York in under 2 hours.
Space Transportation aims to have the aircraft ready for its first flight by 2027 and the first commercial high-speed point-to-point transport flight to take place by 2030.
Yunxing passengers will be high enough to see the curvature of Earth – where the horizon is a slight curve rather than a straight line, normally seen from 50,000 feet.
The jet reached Mach 4 or 3,045mph - four times the speed of sound - at altitudes of more than 65,600 feet
Called Jindouyun, the jet engine reached Mach 4 or 3,045mph - four times the speed of sound - at altitudes of more than 65,600 feet
Jindouyun, or JinDou400, was named after the 'somersault cloud' used by the Monkey King in the classic Chinese novel 'Journey to the West'.
On Tuesday (December 17) it completed its test flight in northwestern China, reports Global Times, the daily tabloid owned by the Chinese Communist Party.
Jindouyun is a 'ramjet' – a type of 'airbreathing' jet engine that uses the engine's forward motion to compress the incoming air.
Ramjet engines burn oxygen directly from the atmosphere, rather than needing to carry their own supply, making them a low-cost, high-power option.
'This test flight provided key performance data on the engine, validating critical systems including the fuel supply, electrical and control systems,' the firm said.
'It also confirmed the engine's stability and reliability, marking a major milestone in its development from a prototype to a fully functional product.'
Powering the Yunxing aircraft, the Jindouyun engine could usher a new era of superfast passenger travel for commuters and holiday-makers alike.
Promo images suggest Yunxing will be a sleek and futuristic vessel, more like something from Thunderbirds than what we're used to seeing at airports.
The successful test flight is a key milestone for developing the Yunxing supersonic civilian jet, which will fly passengers from London to New York in under 2 hours
Powering the Yunxing aircraft, the Jindouyun engine could usher a new era of superfast passenger travel for commuters and holiday-makers alike
Space Transportation aims to have the aircraft ready for its first flight by 2027 and the first commercial high-speed point-to-point transport flight to take place by 2030. Pictured, the firm's promo
Yunxing is now a serious rival for NASA in the race to fly paying passengers aboard a supersonic jet for the first time since Concorde
What are ramjets?
Ramjet engines burn oxygen directly from the atmosphere, rather than needing to carry their own supply.
In a ramjet, the high pressure is produced by 'ramming' external air into the combustor using the forward speed of the vehicle.
Ramjets produce thrust only when the vehicle is already moving; ramjets cannot produce thrust when the engine is stationary or static.
Since a ramjet cannot produce static thrust, some other propulsion system must be used to accelerate the vehicle to a speed where the ramjet begins to produce thrust.
Source: NASA
The plane will be made of lightweight, high-strength composite materials, designed to withstand extreme aerodynamic heating while travelling at Mach 4.
Unlike traditional planes that build speed horizontally for takeoff, Yunxing will perform vertical takeoffs and landings, allowing it to ascend and descend in tighter spaces.
This means it won't have to use conventional runways at today's airports, potentially operating from smaller, urban airport facilities instead.
Yunxing is now a serious rival for NASA in the race to fly paying passengers aboard a supersonic jet for the first time since Concorde.
Developed for NASA by Lockheed Martin, the $247.5 million X-59 plane is capable of cruising at 937 miles per hour – faster than the speed of sound but not anywhere near Mach 4.
However, because of its more modest supersonic speeds, X-59 may be a more realistic contender for passenger travel in the near-term compared with other experimental vehicles in development
If cleared for commercial travel, it could be used by flight operators and take passengers from London to New York in under four hours – still slashing today's travel time in half.
The X-59's thin, tapered nose accounts for almost a third of its length and will break up the shock waves that would ordinarily result in a supersonic aircraft causing a sonic boom
Meanwhile, another American company called Boom Supersonic is working on its own supersonic craft, called Overture, which is eyeing commercial passenger flights in 2029.
Last year, a scaled-down prototype of Overture, called XB-1 Baby Boom, has completed 'key milestones' during testing as it progresses towards its first flight.
As for Concorde, the legendary Anglo-French creation had its first commercial flights in 1976, but it was grounded in October 2003 in the aftermath of the catastrophic Air France Flight 4590 crash.
Other reasons for the demise of Concorde were high fuel costs, concern over its noise and a preference for lower fares over speed.
No government or manufacturer has since been able to build a commercial plane that can travel faster than the speed of sound.
THE HISTORY OF CONCORDE
Concorde was a turbojet-powered supersonic passenger jet that was operated from 1976 until 2003.
It had a maximum speed over twice the speed of sound at Mach 2.04 (1,354mph or 2,180k per hour at cruise altitude) and could seat 92 to 128 passengers.
It was first flown in 1969, but needed further tests to establish it as viable as a commercial aircraft. Concorde entered service in 1976.
Concorde was the world's first supersonic airliner and operated for 27 years, but it was grounded in October 2003. Pictured is British Airways Concorde G-BOAB taking off with its landing gear still extended over the Cotswolds town of Fairford, Gloucestershire on July 20, 1996, during the annual RAF Fairford airshow
It is one of only two supersonic transports to have been operated commercially. The other is the Soviet-built Tupolev Tu-144, which ran as a passenger aircraft only for a few years in the 1970s due to safety issues.
Concorde was jointly developed and manufactured by Aérospatiale and the British Aircraft Corporation (BAC) under an Anglo-French treaty. Concorde's name, meaning harmony or union, reflected the cooperation on the project between the UK and France.
Concorde was retired in 2003 due to a general downturn in the commercial aviation industry after its only crash in 2000, the September 11 attacks in 2001, and a decision by Airbus, the successor to Aérospatiale and BAC, to discontinue maintenance support.
The Long March 10 builds on China's current rocket, the Long March 5. The next-gen spacecraft inherits technology from the current Shenzhou spacecraft that sends astronauts to China's Tiangong space station. China has already conducted three successful robotic lunar landings with the Chang'e 3, 4 and 5 missions.
China's moon landing plan is to launch two Long March 10 rockets, with one for the lander and another for the crew spacecraft. The lander and the crewed spacecraft will rendezvous and dock in lunar orbit. A pair of astronauts will then move over to the lander and then head down to the lunar surface, where they will do a variety of scientific work and collect some moon samples during a stay lasting around six hours.
"The development of the lunar lander and the new spacecraft is still taking advantage of the previous technologies. We are also accelerating the assessment and development of the manned lunar rover," Fan Ping, chief designer of space stations at Shanghai Academy of Spaceflight Technology (SAST), told China Central Television.
"China has announced the goal of landing people on the moon by 2030," Fan Ping said. "And after the goal is accomplished, the next could be the building of a lunar research station, so that we can establish our own home on the moon for more scientific experiments."
China is currently working on attracting partners for a project called the International Lunar Research Station. The country, together with Russia and other partners, aims to begin building the lunar outpost after launching precursor Chang'e 7 and 8 missions around 2026 and 2028.
China names the spacecraft that will put its astronauts on the moon (video)
Beste bezoeker, Heb je zelf al ooit een vreemde waarneming gedaan, laat dit dan even weten via email aan Frederick Delaere opwww.ufomeldpunt.be. Deze onderzoekers behandelen jouw melding in volledige anonimiteit en met alle respect voor jouw privacy. Ze zijn kritisch, objectief maar open minded aangelegd en zullen jou steeds een verklaring geven voor jouw waarneming! DUS AARZEL NIET, ALS JE EEN ANTWOORD OP JOUW VRAGEN WENST, CONTACTEER FREDERICK. BIJ VOORBAAT DANK...
Druk op onderstaande knop om je bestand , jouw artikel naar mij te verzenden. INDIEN HET DE MOEITE WAARD IS, PLAATS IK HET OP DE BLOG ONDER DIVERSEN MET JOUW NAAM...
Druk op onderstaande knop om een berichtje achter te laten in mijn gastenboek
Alvast bedankt voor al jouw bezoekjes en jouw reacties. Nog een prettige dag verder!!!
Over mijzelf
Ik ben Pieter, en gebruik soms ook wel de schuilnaam Peter2011.
Ik ben een man en woon in Linter (België) en mijn beroep is Ik ben op rust..
Ik ben geboren op 18/10/1950 en ben nu dus 75 jaar jong.
Mijn hobby's zijn: Ufologie en andere esoterische onderwerpen.
Op deze blog vind je onder artikels, werk van mezelf. Mijn dank gaat ook naar André, Ingrid, Oliver, Paul, Vincent, Georges Filer en MUFON voor de bijdragen voor de verschillende categorieën...
Veel leesplezier en geef je mening over deze blog.


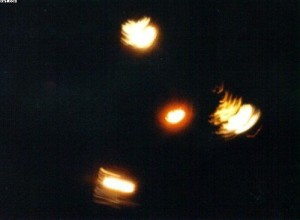


.jpg)
.jpg)
.jpg)